


Proxy metrics in E-commerce. Part 2


In the first part we discussed the problems arising when estimating LTV of online store users and how they can be solved with the help of proxy metrics. We also described how companies from different fields search for such metrics and shared our own list of found metrics applicable to e-commerce.
The second part (i.e. the one you’re reading now) is more technical: in it we explain in detail how to find and select useful proxy metrics from a variety of options, how well they predict customers’ LTV, whether stores with different product categories can use them, etc.
The third and final part is more applied: in it, we’ll discuss how businesses can work with the resulting metrics to increase the LTV of users, and with it the long-term revenue of the online store.
But back to the technology for finding proxy metrics. For our research, we used machine learning techniques and extracted statistical patterns from the data. Therefore, it will be logical to first tell you about the data we used, on the basis of which we drew conclusions.
Data sources
Retail Rocket has more than 1000 clients all over the world: Russia, Europe, Latin America, CIS, some of whom have been working with the company for many years. We selected 27 online stores specializing in various product categories for the research.
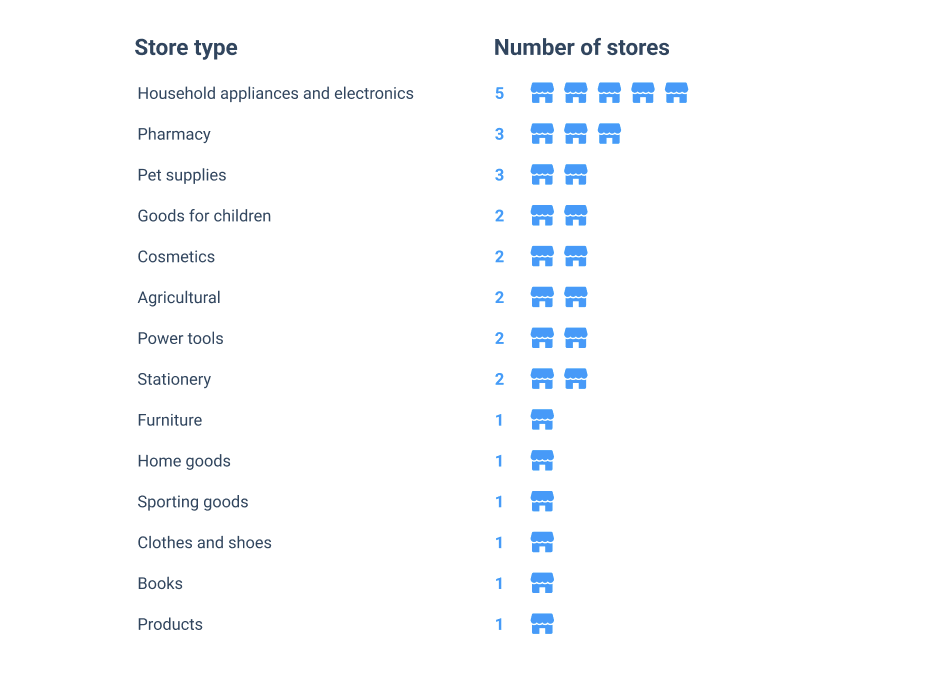
This variety of stores was needed to test whether the proxy metrics found would be universal.
Data description
Each visitor to the online store has an identifier stored in a cookie. This can be used to track which events related to the user occurred, when and how.
Such events include:
- Ordering an item;
- Adding a product to the cart;
- Viewing an item;
- Viewing a category;
- Viewing a page on the site;
- Using the site’s search engine;
- User left their email.
According to our data, approximately 10% of all cookies “live” for more than 120 days – which is enough to reveal links between attributes and LTV. However, there is a problem: some users reset the cookie and return to the store with a new ID. Because of this, it’s harder to determine how certain traits affect LTV. Perhaps with more accurate user identification, the connections we found will be stronger.
The logic behind the formation of attributes and the target variable
To make it easier to understand, let’s introduce the following terms:
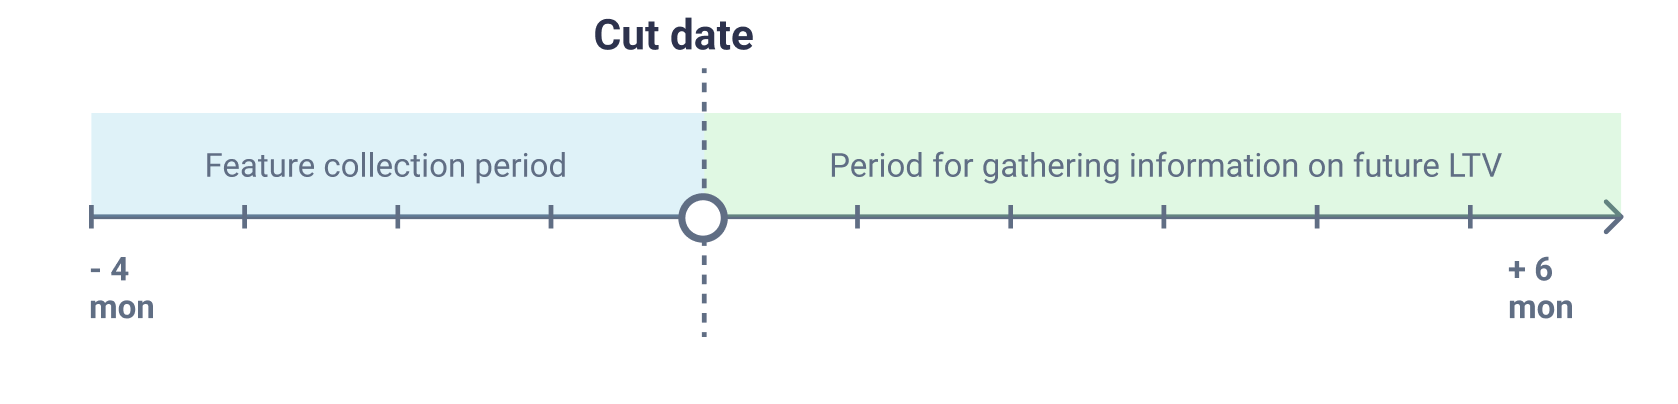
The cutoff date is the date that separates two periods: the feature collection period (4 months before the cutoff date) and the future LTV information collection period (6 months after the cutoff date).
For example, if the cutoff date is July 1, 2020, then attributes are collected from March 1, 2020 to July 1, 2020 inclusive, and future LTV information is collected from July 2, 2020 to January 1, 2021 inclusive.
The target variable in our study (the information we want to predict) is the fact of purchase during the period of collecting information about future LTV. We considered only visitors from the feature collection period and, if we did not find any related events during the period of future LTV information collection, we considered that such a user did not buy anything.
To test whether the dependencies we found were stable over time, we took 6 slices from each of the 27 stores (the first day of each month from July through December 2020).
To select candidate proxy metrics, we compiled an extensive list. It included attributes related to:
- Orders: quantity, age of last purchase, average check, revenue, etc;
- Adding items to the cart: over time, over the last week;
- Familiarity with the catalog of the store: the number of views of products, categories, the number of views in the last week;
- Use of the site search engine: the number of queries in the site search engine for the whole time, for the last week;
- Time spent on the site: the difference in days between the first and last visit to the site, the age of the last visit to the site, activity on the site during working and non-working hours, on specific days of the week;
- The fact of subscription: whether you left an email or not, how long ago you became a subscriber;
- The device from which the site was visited: computer or smartphone, exact browser version, user’s IP
Different ratio of attributes and aggregates: for example, the share of product views for the last week to views for the whole time, the total number of category, product and search views, the share of search in all user actions on the site, etc.
We conducted the study for all 27 stores, but for simplicity we will show as an example the results of the two largest and most differentiated stores. “Store 1” has the most visitors making orders and a short consumption period, while “Store 2” on the contrary has the least number of visitors making orders and a long consumption period.
Selecting attributes by their influence on the target variable
The target variable is binary – the user will either make a purchase or not – so we measured the strength of individual features and the model as a whole using the ROC AUC metric.
First, we looked at how significant each feature was using a bousting algorithm over decision trees. Then we left the features with a high ROC AUC value. In this way we weeded out the weak features and found many good candidates for proxy metrics with high ROC AUC values among the remaining ones.
Selection of features by correlation
There were many pairs with high correlation among the attributes. It is pointless to include them together in the final list of LTV proxy metrics, since they change in the same way, and it is difficult to track a large number of attributes. Also, if you train the model on a correlated set of attributes, there may be problems with parameter stability and further use of the model.
For example, there are three strong attributes:
- Number of product views;
- Number of different products viewed;
- Number of different categories viewed.
The correlation between them is greater than 80%: all of them indicate that the user has familiarized with the store’s catalog and is interested in its products. Hence, any of these attributes can be taken as a proxy metric. Most likely, “number of different categories viewed” will be more useful for stores with a large number of categories, and “number of different products viewed” will be more useful for stores with several categories but a large number of different products.
We kept the “number of different products viewed” attribute because it is responsible for familiarity with the catalog and is related to the effective size of the catalog. Also, we pushed back on the review article, which evaluates it as having business value.
In turn, the metric “number of product views” is not always robust to outliers in the data. For example, if a visitor has viewed a single product an abnormally high number of times, it has little business value.
We did the same with other pairs of correlating attributes. In the end, we left a few attributes about orders (they are correlated, but often used by our clients as proxy LTV metrics) and the strongest attributes unrelated to orders:
- Number of orders;
- Average check;
- Revenue;
- The age of the last order in days;
- Visitor left email;
- Browser type;
- Device type;
- Length of time since last visit to the site;
- Number of different products viewed;
- Duration of user’s interaction with the site in days (difference in days between the first and last visit);
- Number of queries in the site’s search engine;
- Number of products added to the cart.
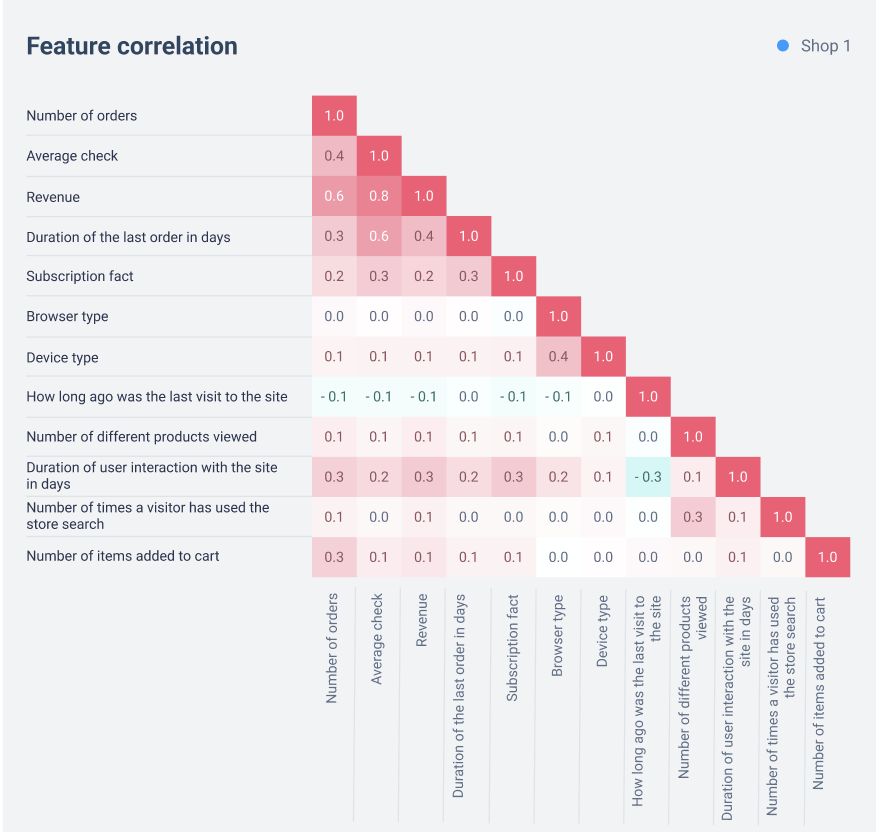
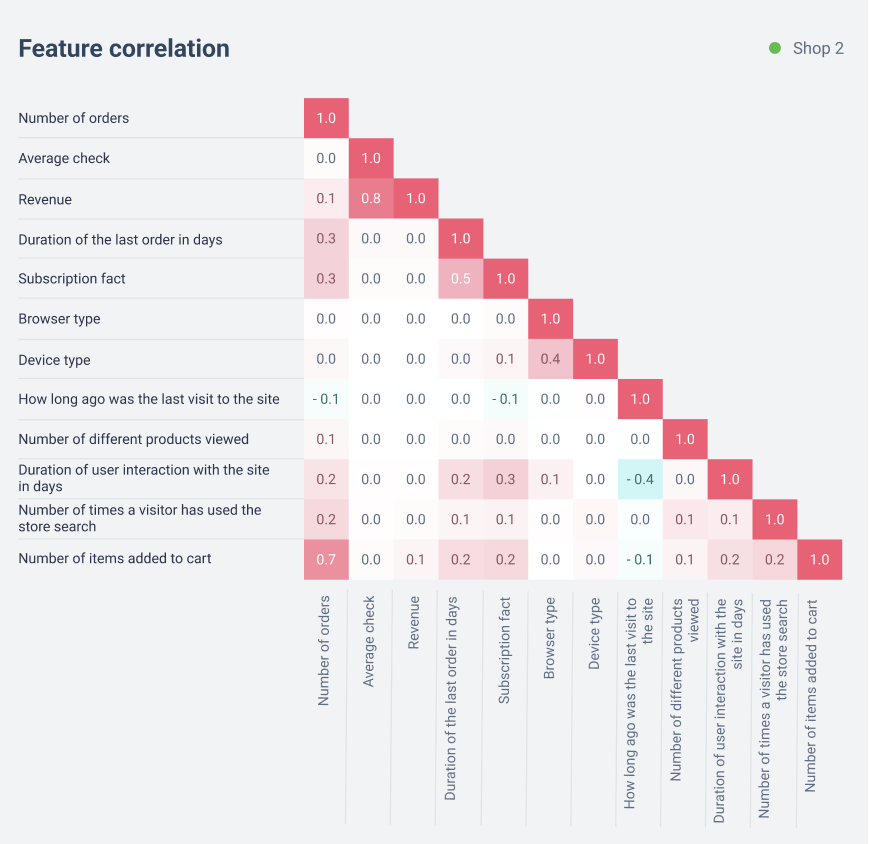
As we can see in the graphs above, only order-related attributes and a few other pairs correlate with each other:
- Browser Type and Device Type have a relatively weak correlation, so both of these attributes may be useful to a store. However, for some stores, it may be better to combine them into one;
- Number of items added to cart and number of orders also have a correlation, as it is common to add an item to the cart before ordering it. The degree of correlation of these attributes depends on store characteristics, for example, the proportion of abandoned baskets. In the graphs we see that for Store 1 the correlation is low;
- The fact of subscription and order-related attributes can correlate with each other, because in some stores users automatically become subscribers after making a purchase.
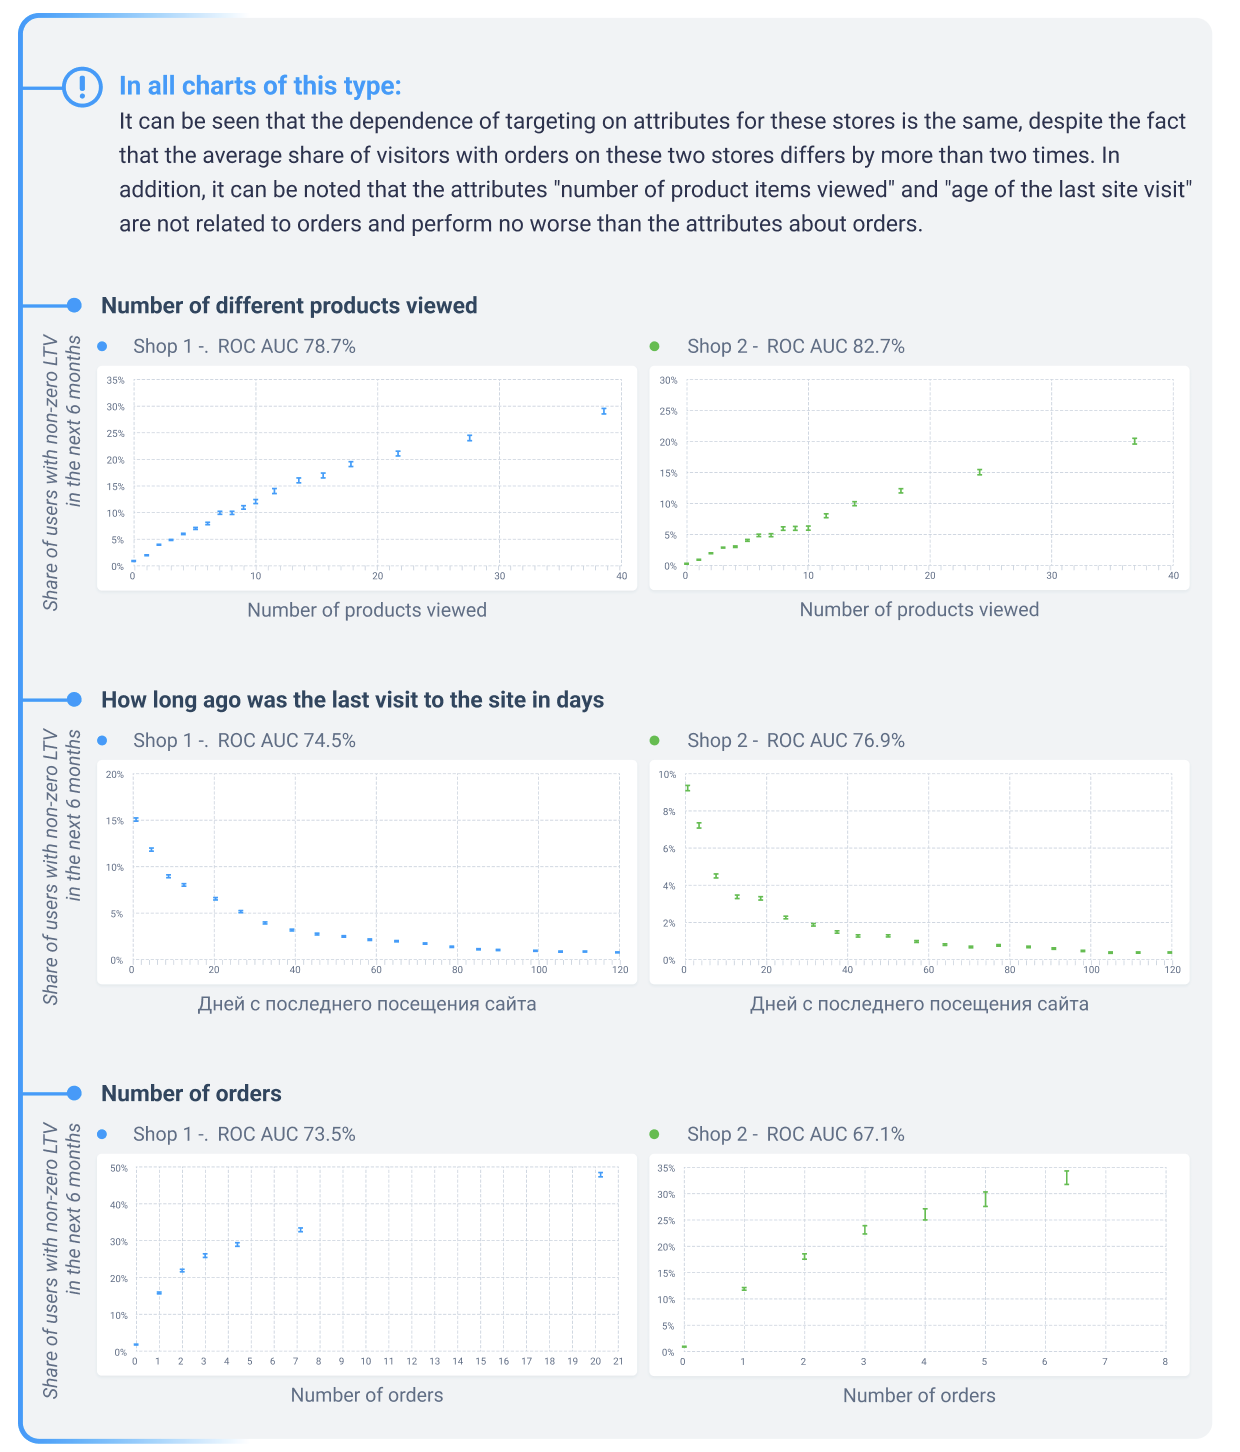
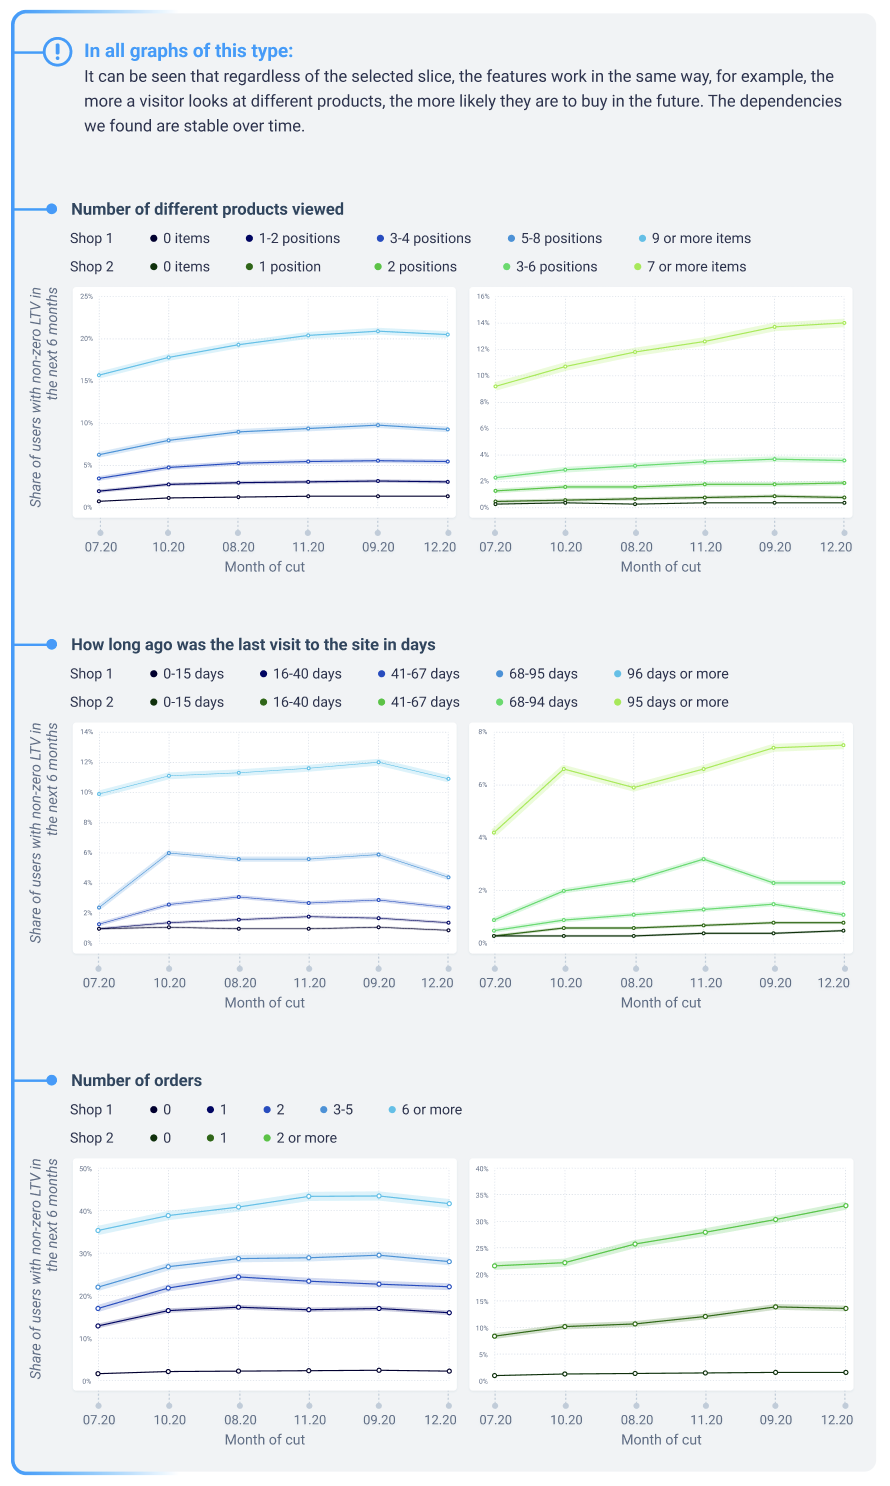
Checking the stability of trait performance over time
Traits have the same effect on future LTV estimates regardless of the cutoff date. For example, if users with 10 views of different products on average have a higher future LTV than users with 2 views, this is true for every month.
To test this assertion, we constructed graphs on which we categorized visitors into groups by intervals of attribute values and for each group we plotted the proportion of visitors who made an order in the future.
Contribution of selected proxy metrics to model quality
Based on the selected attributes, we built the model using bousting over decision trees – sequentially adding attributes in the following order and measuring its quality:
- Order-related attributes;
- Number of items added to the cart;
- Visitor left email;
- Device type;
- Browser type;
- Number of queries in the site’s search engine;
- Length of time the user interacted with the site;
- Number of different products viewed;
- The length of time since the last visit to the site;
This ordering was necessary to see if the non-order-related attributes carried additional useful information for the model compared to the order-related attributes.
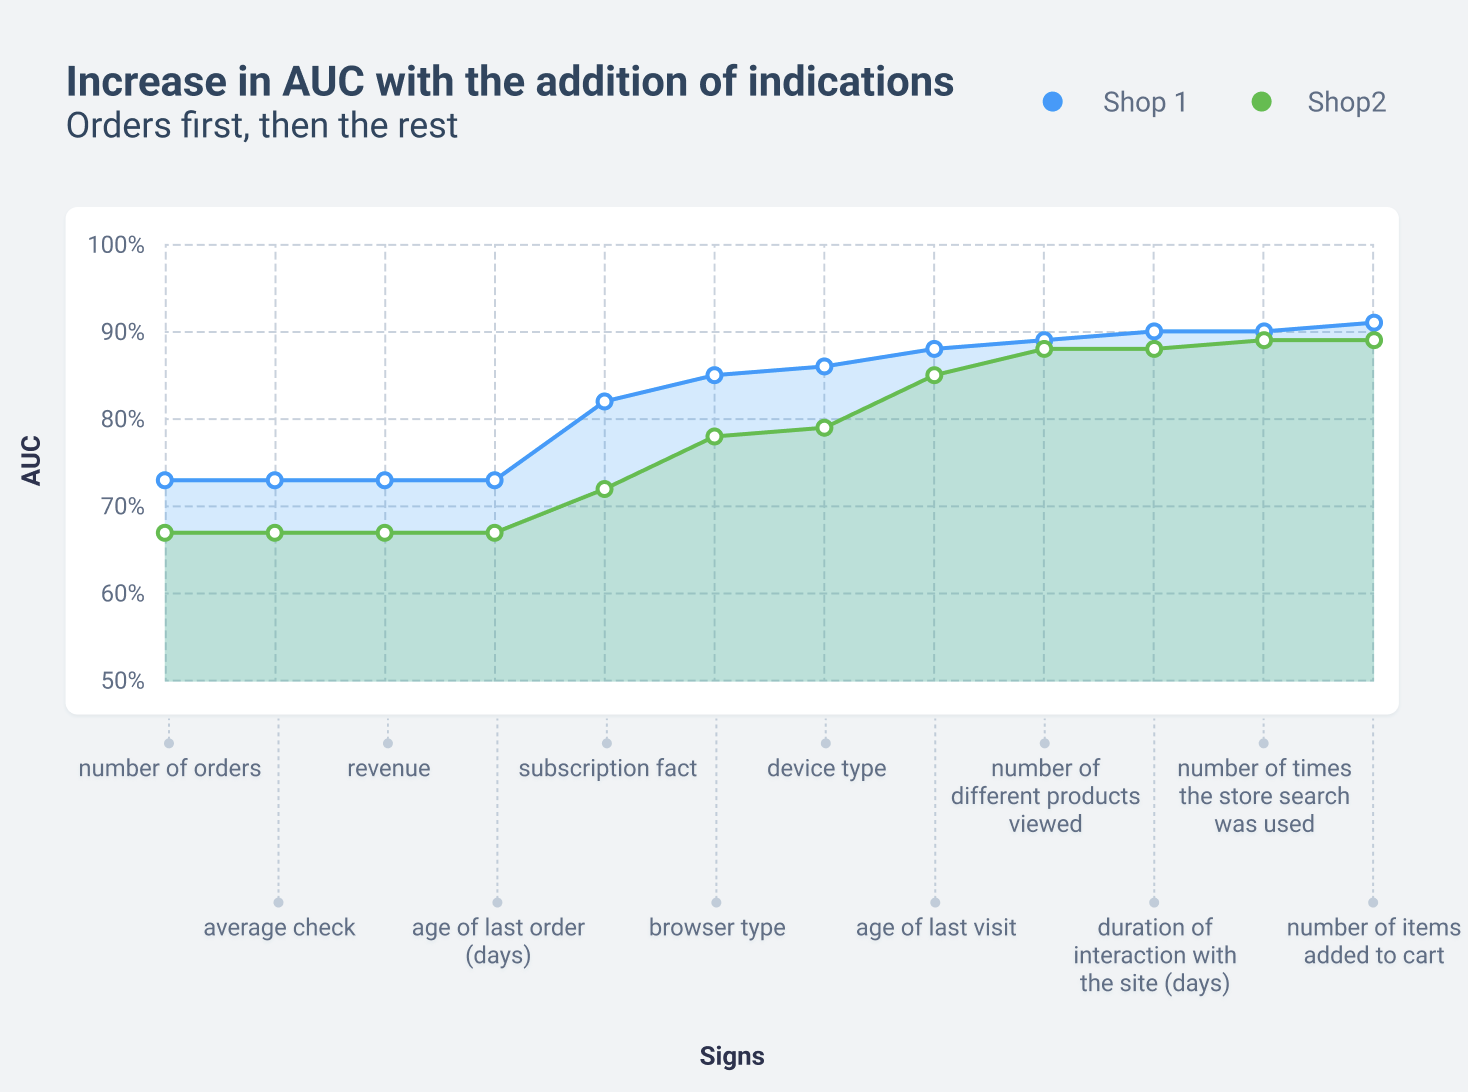
As we can see above, order-related attributes (average check, revenue, last purchase) add little additional information to the “number of orders” attribute, so we can leave one order-related indicator among the proxy metrics. We chose the most robust to outliers – “number of orders”. In this graph, you can also see how important all subsequent attributes are – each adds LTV information not contained in the previous attributes.
We performed such analytics for all 27 stores – and everywhere, the non-order-related attributes we selected showed a strong correlation with LTV and added a lot of additional information to the order-related attributes.
Often a single attribute, such as “number of different products viewed” or “age of last site visit” had a ROC AUC greater than all order-related attributes combined. This is due to the fact that compared to the entire mass of visitors to online stores, orders are made by a very small proportion of users. Accordingly, there is less data on them. In our sample, only one store had a 10% share of users with orders, while the rest had 2-5%.
Then we changed the order of adding attributes and saw how the model changes if we first load non-order-related attributes into it and then order-related ones.
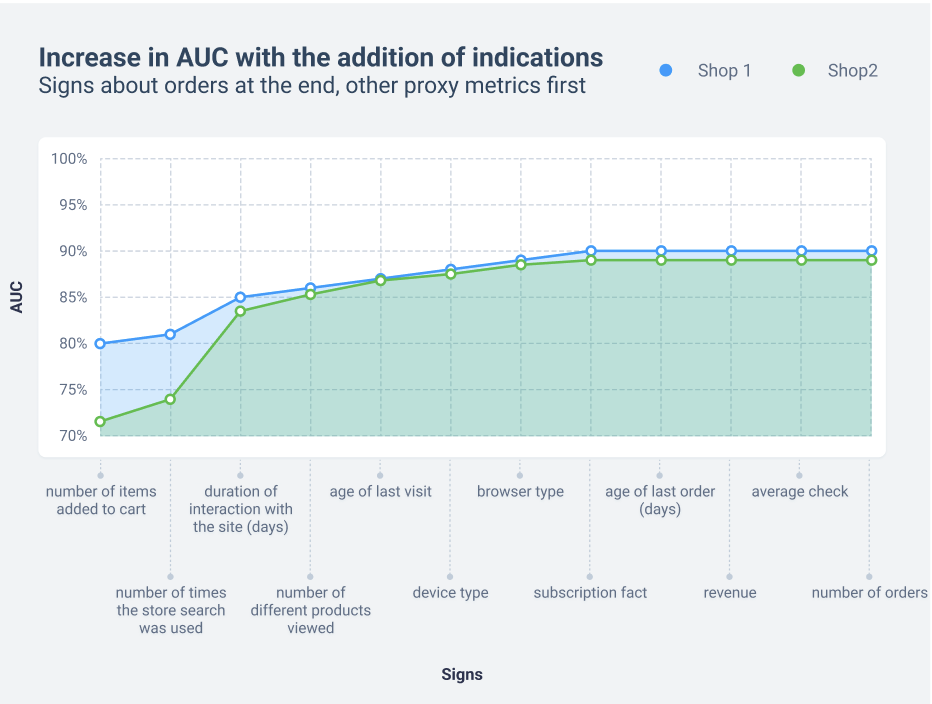
We tested the findings of this chapter on all the stores we studied, and they were confirmed.
In the next section, we will discuss how businesses can work with these metrics to increase the LTV of users and, with it, the long-term revenue of an online store.