


Proxy metrics in E-commerce. Part 3


In the first part we discussed the problems arising when estimating LTV of online store users and how they can be solved with the help of proxy metrics. We also described how companies from different fields search for such metrics and shared our own list of found metrics applicable to e-commerce.
In the second part, we described the technical side of selecting proxy metrics: we explained how to find and select the most useful ones from a variety of options, how well they predict customer LTV, whether stores with different product categories can use them, etc.
The third and final part is more applied. In it, we will discuss how to select metrics that make sense from a business perspective and use them to make decisions that increase the LTV of users and, with it, the long-term revenue of an online store.
Interpreting the resulting proxy metrics from a business perspective
Recall that in Part 2 we selected the following proxy metrics:
- Number of orders;
- Visitor left email;
- Browser type;
- Device type;
- Duration of the last visit to the site;
- Number of different products viewed;
- Duration of user’s interaction with the site in days (difference in days between the first and last visit);
- Number of queries in the site’s search engine;
- The number of products added to the cart.
We don’t need to explain the presence of order-related attributes in our list – their influence on LTV is clear: according to RFM-analysis, the more orders a user has made, the more loyal he is to the company and the more likely he is to continue buying from you in the future.
Now let’s try to explain how the other attributes can predict LTV:
The visitor left an email. The fact that a customer has handed over his contact details is a clear sign of loyalty to the store. In some stores, you can’t place an order without leaving an email, and you might assume that the email left is just a consequence of the order. But we tested and found that leaving an email without placing an order can have a positive impact on future LTV. This is probably due to the fact that knowing the user’s email, the store can communicate with him/her, incentivizing further purchases. However, in this case much depends on the effectiveness of mailings.
Browser type. This metric can influence LTV, and for each store it will be different: Safari users are more likely to make a purchase in one store, while Firefox users are more likely to make a purchase in another. It may depend on the category of goods in the store. For example, if a store has a large assortment of Apple products, Safari users are likely to be more loyal to it. Another reason is that the site looks and functions differently depending on the browser.
Device type. Essentially, there are only two options here: computer and smartphone. We see in many stores that customers who use a computer are more likely to purchase in the future. This may be due to the fact that it is more convenient to order from it and generally use the site than from a mobile device.
The length of time since the last visit to the site. The metric is directly related to user loyalty. For example, if a person has not visited the site for more than two months, it is possible that he has already forgotten about it or has not found a product of interest to him, so he is unlikely to return in the future.
The number of different products viewed. The more the user has viewed different products, the larger the effective size of the catalog and the better the person is familiar with the store and the higher the probability that he will remember about it when he wants to buy something.
Duration of the user’s interaction with the site in days. If a person for a long time visits the site on different days, it indicates that the online store is interesting to the user and he knows that he can find the goods he needs there.
The number of requests to the site’s search engine. Regular interaction of the user with the search engine of the online store says that it works and well helps the user to solve his tasks.
The number of products added to the cart. This attribute can correlate with order-related attributes, as some of the baskets are transformed into orders. But its coverage can be many times greater if the store has a lot of “abandoned baskets”, i.e. incomplete orders. Next we will show why adding an item to the cart even without a subsequent order is a positive event for the store.
Let’s summarize the intermediate conclusion: all these signs to a greater or lesser extent speak about the user’s activity on the site and his loyalty to the online store. Based on them, you can build a model that will be easy to interpret and use in the future.
LTV prediction model by proxy metrics and formation of overall evaluation criterion (OEC)
We have built a logistic regression model. In doing so, in order to quantify the strength of each attribute in predicting LTV from the coefficients of the model, we normalized them all and thus brought them to a common scale.
To find out the probability of making a purchase in the future, we need to take a linear combination of attributes and apply a sigmoidal function to it. This linear combination can be used to make an OEC (a term we introduced in the first part of the study. It is essentially what the store needs to optimize to achieve its long-term goals).
You can use the OEC model directly. For example, conduct an experiment, measure the difference in performance between two segments, substitute these differences into a linear combination and see which way the OEC changes.
You can simplify – look at changes in individual proxy metrics, select strong changes, control the remaining proxy metrics to remain unchanged, and wait for a corresponding change in LTV. For example, often in tests the average “number of orders” per user does not change much because the share of buyers is usually small, but at the same time the average “number of products added to cart” or the average “number of different products viewed” per user are defined for a large part of users and they will change more strongly.
Quality of model performance
We built linear models for all 27 stores. They predict quite accurately the purchase fact over the next 6 months. Their quality for different stores varies from 0.8 AUC to 0.93 AUC.
From the graph below, you can evaluate the accuracy of the model on “Store 1” and “Store 2”.
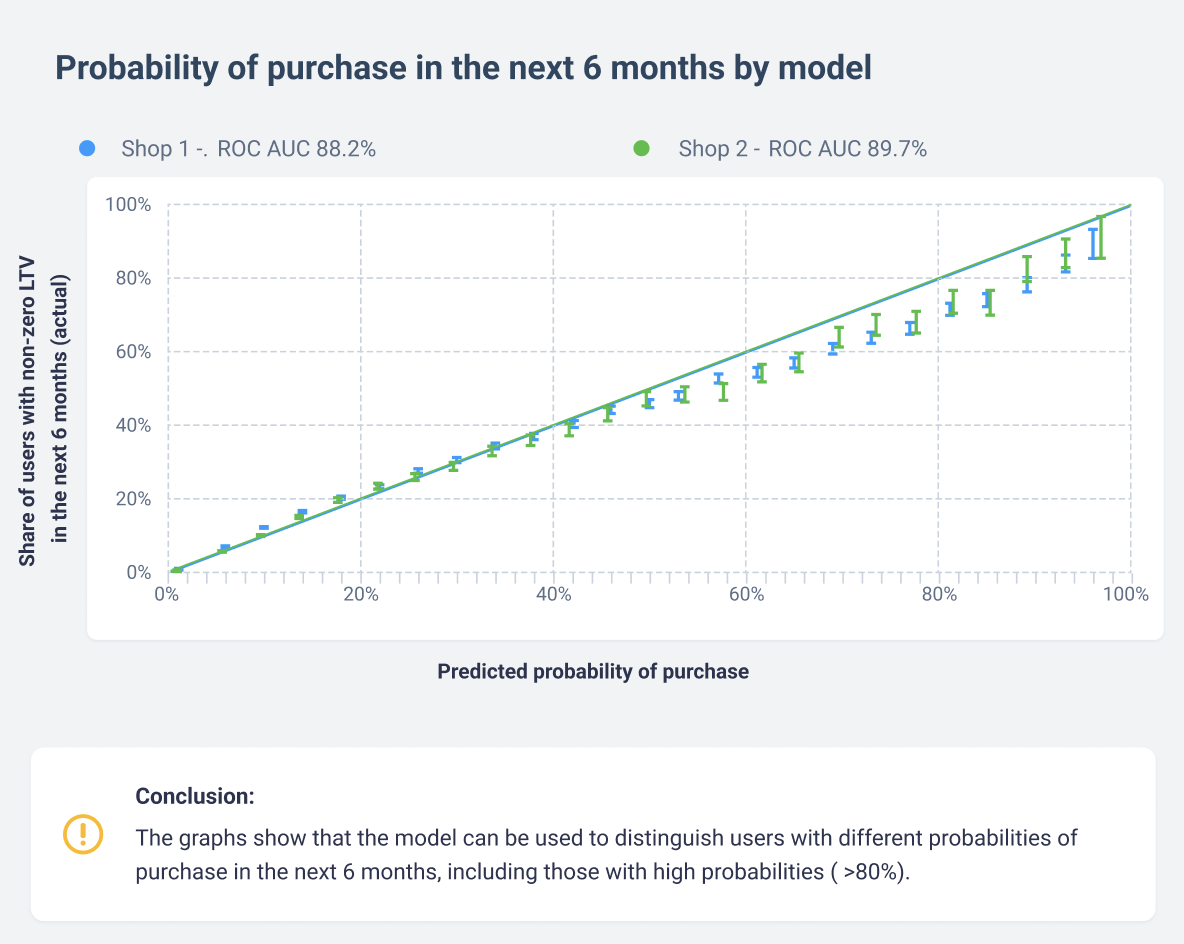
The model divides users well by the probability of future purchase. It can be used to distinguish segments with very high purchase probability (>80%) and almost zero (<1%).
Checking stability of model operation by time
In the second part of the article, we checked the stability of the proxy metrics over time. Similarly, we will make sure that the model itself, created on the basis of these features, works stably.
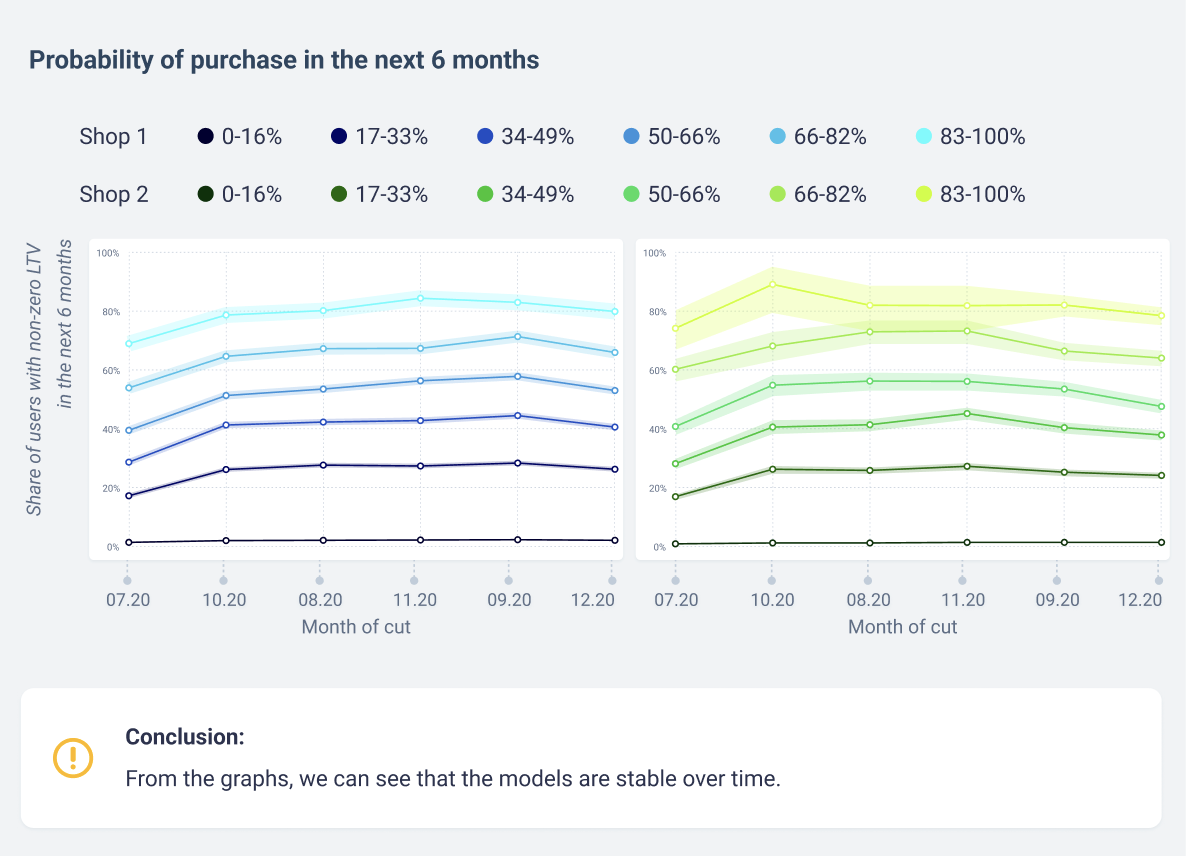
From the graphs, we can see that the models are stable over time.
Model performance across different user segments
The model includes attributes that have useful values for predicting LTV for almost all users, not just those who made an order. Let’s see how it is able to separate visitors by future LTV in three segments:
- The visitor did not add items to the cart and did not make an order;
- The visitor had items added to the cart but no orders;
- The visitor had orders.
In the graph below, we have categorized each user segment into groups based on purchase likelihood according to the model. Each group shows the number and percentage of users who made a purchase in the next six months.
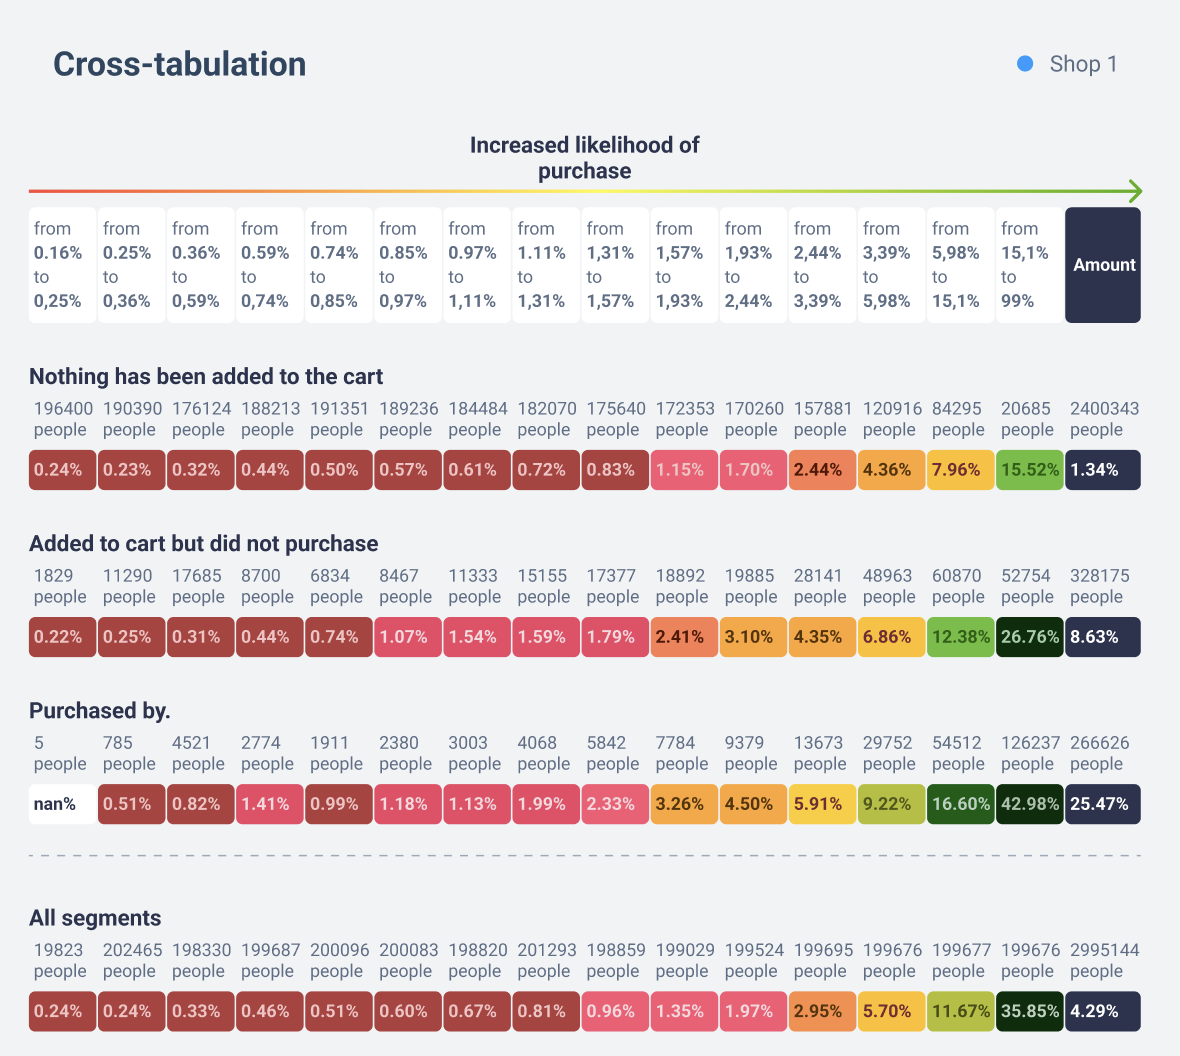
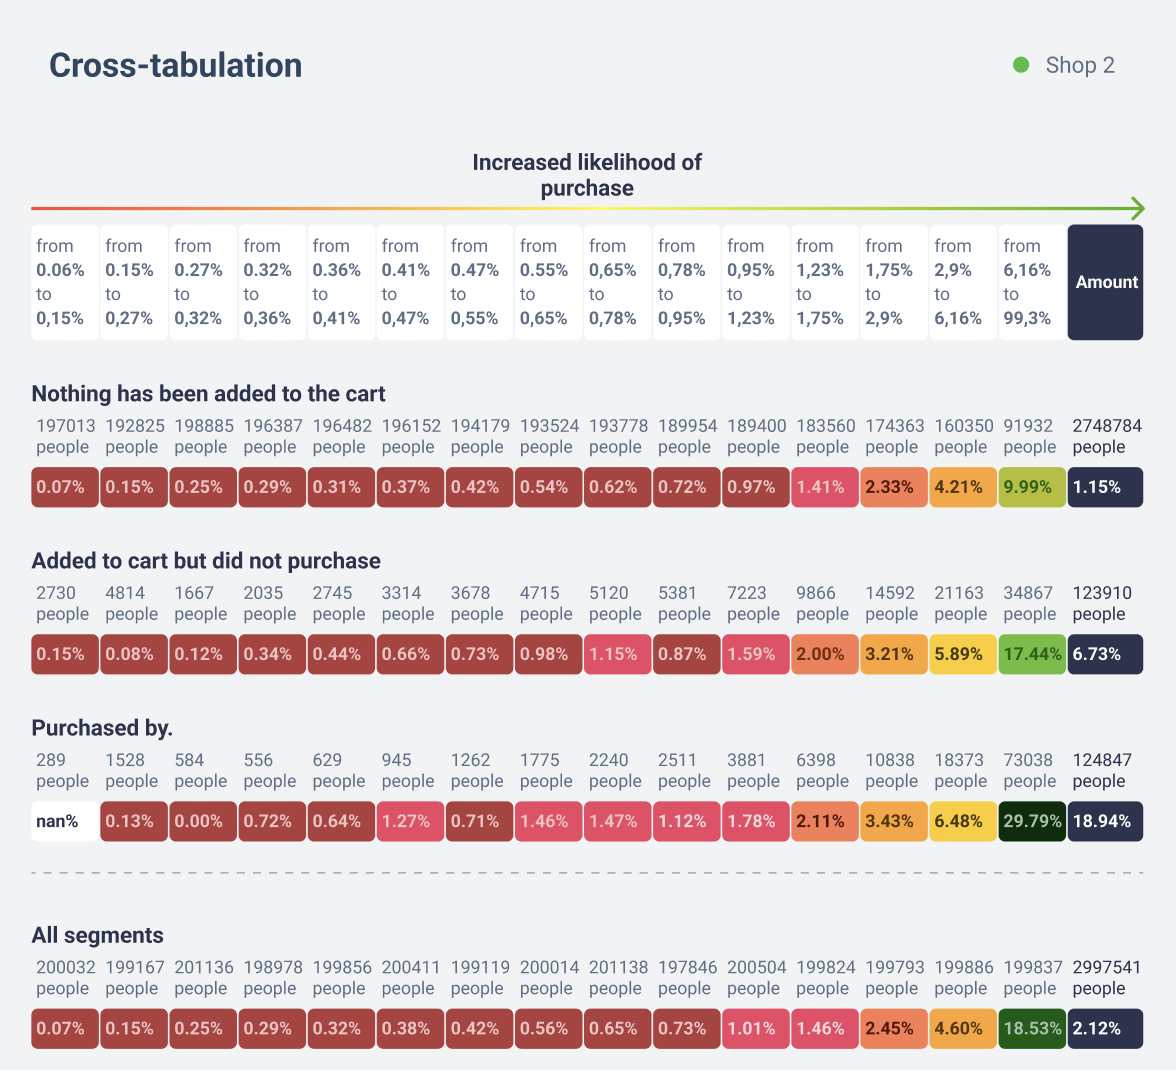
The model is able to distinguish users who are more inclined to buy (even if it happens after a long period of time) from those who have not bought or added anything to the cart. That is, any user activity on the site indicates its potential value for the store. Hence, we can conclude that by increasing user activity on the site, the store can expect an increase in its final long-term revenue.
Conclusions
We have done extensive research and found proxy metrics that can be used to predict the future value of an online store user. They will also be useful for assessing the value of changes to an online store.
Proxy metrics characterize a user’s diverse activity on a website. For example, “the number of different products viewed” speaks about user engagement, “the duration of user interaction with the site in days” and “the age of the last visit to the site” – about returning to the site, “the visitor left an email” and “the number of queries in the search engine of the site” – about using the functionality of the site, “the number of products added to the cart” and “the number of orders” – about solving their current tasks (search for the right product).
The proxy metrics we found are consistent with the recommendation from the review article to focus on HEART: Happiness – satisfaction, Engagement – engagement, Adoption – utilization of site functionality, Retention – return rate and Task success – problem solving.
We also showed that in addition to the order-related metrics – “average check”, “conversion to customer”, “revenue per visitor” – that most online stores monitor and optimize, there are more useful metrics. We see the big plus of our suggested metrics as being much more sensitive to change than the commonly used attributes about orders, as they have useful values for predicting LTV for most store users.
Using proxy metrics, it is possible to generate OEC. In the paper, we propose to do this using logistic regression, taking into account the expertise in a particular business when constructing the OEC formula.
To find good proxy metrics, an online retailer can conduct the same research or use the proxy metrics we found. Their relevance has been tested on 27 stores of different types, so they are likely to be useful for many other online stores as well.