Proxy metrics in E-commerce. Part 1

In the first part, we will discuss the problems that arise when assessing the long-term value of an online store user and how they can be solved by using proxy metrics. We will also tell how companies from different fields are looking for such metrics and share our own list of developed metrics that are applicable in e-commerce.
In the second part, we will provide a technical description. How the metrics work, whether stores with different product categories can use them, how useful proxy metrics can be selected from a variety of options, and how well they predict long-term user value.
In part three, we’ll discuss the business interpretation of the resulting metrics and how you can use them to optimize the long-term value of users, and therefore the long-term revenue of your online store.
What are proxy metrics and why do you need them
One of the key metrics that most companies (including online stores) optimize is LTV, i.e. a measure of the revenue a business generates over the entire time it has been working with a customer.
Knowing LTV allows you to forecast revenue, plan advertising costs, estimate ROI, calculate the most loyal visitors, segment the audience by value, etc. Accordingly, it is a very important metric, and when any significant change is planned, it is important to know how it will affect LTV.
How a change has affected the metric is evaluated in relation to another change or lack thereof. This is usually accomplished by hypothesis testing using hypothesis tests. If long-term metrics – such as actual LTV – are used, we face the following problems:
- Hypothesis testing takes longer and, as a result, changes take longer to implement;
- If several tests are conducted at once, it is not always clear which change ultimately increased or decreased LTV;
- In case of long-term testing, it is necessary to maintain and calculate all tested versions of algorithms all the time;
- Online retailers often make non-hypothesis-related changes that are highly likely to affect the behavior of the test;
- The longer the test is run, the more often store errors occur that make the result unreliable;
- In e-commerce, a unique user is usually identified by cookies, which are often lost in a long test. For example, this article describes a Facebook experiment where there were several different cookies per user – they fell into different segments of the test and made it difficult to identify the real effect of the change.
Because of the above problems, it is almost impossible to test improvements based on changes in actual LTV. As a solution, we propose to use LTV proxy metrics, which take much less time to detect changes.
The proxy metric is a proxy measure of the target metric, with which it is highly correlated. By the change in the proxy metric, we should at least understand the direction of change in the target metric. For example, GDP per capita might be a proxy metric for the quality of life in some region.
Often our clients (online retailers) choose order-related attributes as LTV proxy metrics: e.g., conversion to customer, average number of orders per user, average check, average revenue per user in the past, etc. These attributes correlate with future LTV, because if a user has made a purchase in the past, the likelihood of a repeat purchase in the future increases.
But an important question remains: are there no proxy metrics more useful for assessing the impact on future LTV of current store changes? We decided to explore this.
How proxy metrics are chosen and used outside of E-commerce
Proxy metrics are used to form an overall evaluation criterion for change – OEC (overall evaluation criterion, read more in Microsoft’s article). This is a quantitative measure of the purpose of the experiment, which should reflect the business goals of the company – for example, be related to LTV.
It is needed to automate and formalize the process of making a decision to implement certain changes. When forming an OEC, the metrics of all the goals of the experiment are reduced to a single indicator.
The current challenges of online experiments are well covered in a review article from employees at Microsoft, Google, Facebook, LinkedIn, AirBnb, Netflix, Amazon, Yandex, Uber, and Twitter. It discusses the problems encountered in estimating long-term effects and lists the properties of good proxy metrics for OEC:
- Proxy metrics should be related to a long-term target, such as LTV. At a minimum, it should be clear in which direction the indicator will change when the metrics are changed;
- Good proxy metrics are difficult to improve by doing the “wrong” things. For example, YouTube uses a long CTR metric instead of conversion to clicks (CTR), where a click only counts if the user has viewed a substantial portion of the video. This is because CTR can be increased by using “clickbait” in the title and misleading the user about the content of the video, which ultimately reduces satisfaction with the service;
- Proxy metrics should be sensitive to changes that affect the long-term target. For example, users of a particular device type can significantly influence the long-term target, but it is difficult to increase this proportion;
- Calculating proxy metrics does not require many resources. For example, opinion polls are not suitable as such metrics;
- The criterion formed on the basis of proxy metrics can take into account new scenarios. An example of an inflexible criterion – a store sold TVs and took a metric based on screen diagonal. Then they added vacuum cleaners to the assortment, to which this metric does not apply, so it cannot be used to account for the new type of product.
Finding appropriate proxy metrics for OEC is not always easy. The Microsoft piece gives an example of how Microsoft’s Bing search engine chose intuitive metrics for optimization: number of search queries and revenue. At some point a bug appeared, and the search results began to work clearly worse – users were shown 10 advertising lines per rendition at the beginning of the list. In order to find the desired result, people had to make more queries, so there was more advertising, and revenue increased with it.
These changes short-term increased the number of queries per user by 10% and revenue by 30%, but if they were implemented, it would reduce user loyalty and they would eventually leave for competitors. This example illustrates how short-term metrics can diverge from a company’s long-term goals.
It’s easy to do the same thing in an online store – increase all prices, which may lead to an increase in the average check and revenue, but in the long run, users will prefer competitors.
Another disadvantage of using attributes about orders as proxy metrics is their low sensitivity, as often only a small part of the entire user flow makes orders – usually up to 5%. Therefore, in order to capture significant changes in these metrics, you need to conduct long tests.
There are two popular ways that companies turn to in order to find useful proxy metrics of a long-term target:
- Utilize subject matter and business knowledge. For example, search engines Bing and Google have defined their long-term target metric in this way as user satisfaction with the service, and proxy metrics are the number of sessions and the number of search queries per session. Few queries per session and many sessions themselves mean that the user finds the answer they are looking for quickly and returns to the searcher regularly.
- Use machine learning algorithms to identify features that will predict long-term metrics well. For example, this article describes how Netflix learned to predict whether or not a user will keep their subscription for the next month (retention). They found a strong correlation between retention and the time a user spends watching content (a measure of user engagement) and used the measure of user engagement as a proxy metric for retention. LinkedIn derived their proxy metrics in much the same way and built an LTV prediction model.
These two methods combine well – you can find a number of candidate proxy metrics using machine learning and select only the ones that make business sense.
What proxy metrics we’ve arrived at
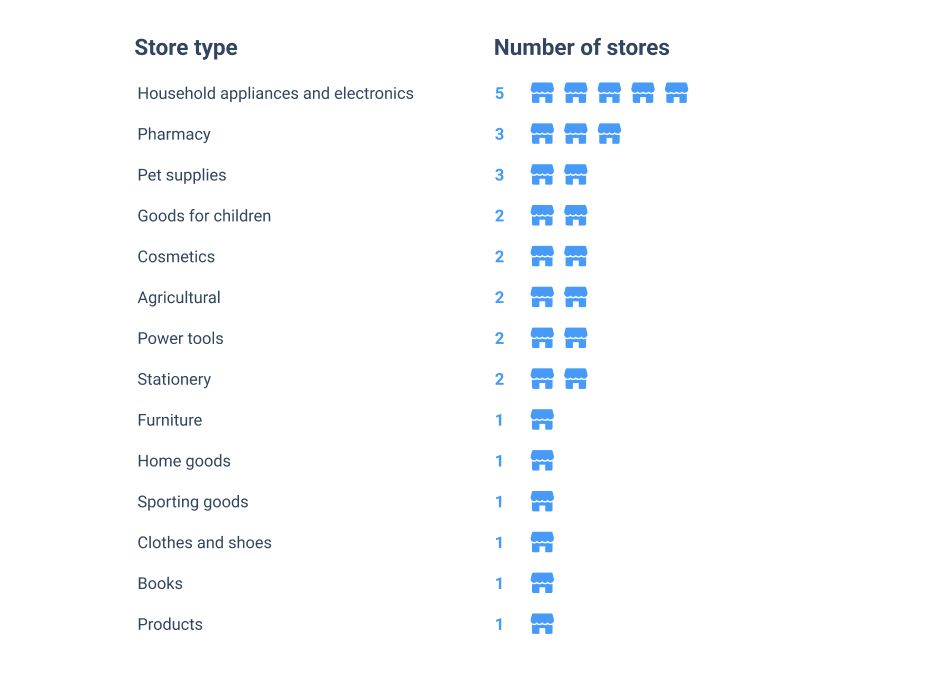
To find candidate proxy metrics to LTV we used machine learning algorithms. We then selected among them the ones that are most useful and understandable to the business. In our study, we relied on data from 27 stores with different product categories. This diversity allowed us to find the most universal and useful proxy metrics that should work for many stores.

To predict the LTV of this set of stores, we used the following metrics:
- Number of orders;
- User subscription fact;
- Duration of the last visit to the store;
- Number of different products viewed;
- Duration of user interaction with the store;
- How many times the visitor used the store’s internal search;
- The number of products added to the cart.

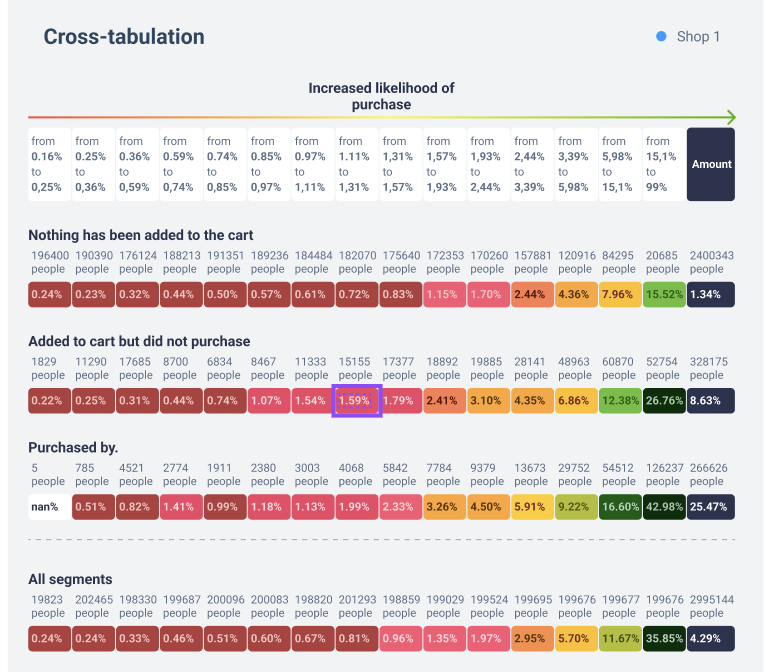
The graph shows the result of the model based on the above proxy metrics (an example of one of the stores).
We divided users into three segments depending on their actions in the past:
- Buying
- Added items to the cart, but did not buy
- Did not add anything to the cart
We then categorized users in each segment into groups based on their likelihood of purchase according to the model. Each group shows the number and percentage of users who made a purchase in the next six months. As we can see, the model is adept at highlighting visitors who are more likely to buy in the future, even among those who haven’t bought or added anything to their cart.
In the next installments, we’ll detail how we selected proxy metrics from an extensive list of candidates, and how accurately they help predict LTV.
We will also describe the technical details of the study.


